Debugging Asynchronous JavaScript With Watch Expressions
I’ve recently found myself deep in the depths of JavaScript land. Catalog is a project of mine that has a few moving parts. It is a chrome extension that allows users to click on a browserAction icon in their toolbar to save or catalog web pages they find interesting or would like to share with friends. This extension communicates with a Rails API back-end that also serves the Angular.js app, displaying users’ cataloged urls. These url’s can be favorited, shared, filtered by attributes, etc. Its very similar to the popular chrome extension/web application Pocket. Being an avid Pocket user myself, I thought it would be fun to build a public, open-source version of their service while learning Angular.js along the way. What follows is a story revealing powerful tools that you, too, can take with you into the trenches of this wild world that is modern-day JavaScript.
Unlike Hollywood would like us to believe…

most of our time as developers is not actually spent writing new code,
but rather debugging/refactoring existing code. The majority of bugs are
introduced when some value is not what we expected it to be at a certain
point in a program. Perhaps we were positive that function alexIsAwesome() {}
would always return true, but returned false, or maybe we were sure a
user would never click our button more than 10 times, but sure enough someone
did (*cough screw this guy *cough). This wouldn’t be a big problem, however
we forgot to account for numbers larger than 10 so now we have a bug to hunt!
How do you track down these errors? The most straight-forward way would be
to console.log() the value of some variable at various points in the program
and see how the value changes. You’ve undoubtedly done this before.
example: we declare a variable, counter, and a function increment( ) which simply increments the value of counter by 1 each time it is called. We want to make sure that the value of counter is indeed incremented after increment( ) is called so we log the value before and after.
var counter = 0;

function increment() {
  counter++;
}

console.log(counter);
increment();
console.log(counter);
This approach can be fine for small programs, but can become extremely repetitive and tedious when working on larger programs.
Working on the client-side error-handling of Catalog’s registration/authentication feature this morning I came across an interesting bug.
Problem: If a user tries to register an email that has already been registered, my rails API responds with a status of 409 (conflict) and a message explaining the error - in this case that the email has already been taken.
var button = document.getElementById('register');
button.onclick = function(e) {
  e.preventDefault();
  var email = document.getElementById('email').value
  var password = document.getElementById('password').value
  var req = new XMLHttpRequest();
  req.open("POST","/users",true);
  req.setRequestHeader("Content-Type","application/json");
  req.onreadystatechange = function() {
	  if(this.readyState == 4 && this.status == 200){
      var userId = JSON.parse(this.responseText).user_id
      localStorage.loggedIn = true;
      chrome.storage.sync.set({'userId': userId}, function() {
        console.log('set');
      })
      // do some other stuff
    }
    else if(this.readyState == 4) {
      console.log(JSON.parse(this.responseText).email);
      // do some other stuff
    }
  }
  var myData = {user: {email: email, password: password}};
  req.send(JSON.stringify(myData));
}
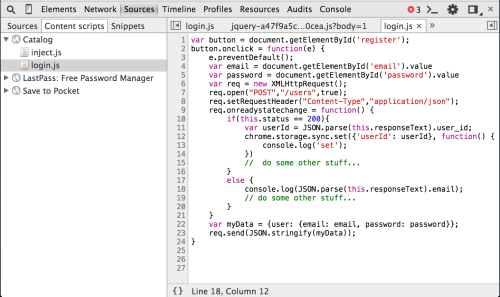
Here’s some basic (incomplete) code that handles the client-side of user registration/authentication. Lines 1 - 5 get the username/password from the form the user has filled out, while lines 6 - 21 handle the ajax request to my Rails API. Let’s focus on lines 9 - 18:
req.onreadystatechange = function() {
  if(this.readyState == 4 && this.status == 200){
    var userId = JSON.parse(this.responseText).user_id
    localStorage.loggedIn = true;
    chrome.storage.sync.set({'userId': userId}, function() {
      console.log('set');
    })
    // do some other stuff
  }
  else if(this.readyState == 4) {
    console.log(JSON.parse(this.responseText).email);
    // do some other stuff
  }
}
As our request is sent to the Rails API, the request object (req) goes through a series of state changes that range from 0 - 4.
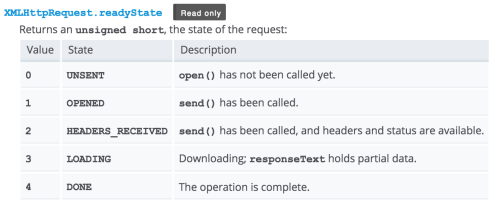
source: https://developer.mozilla.org/en-US/docs/Web/API/XMLHttpRequest
Line 9 says, “Hey req, everytime your state changes run this code inside your function body.”
So, whenever the readyState changes we check to see if the status is 200
(meaning registration was successful) and if it was a success then save the
userId to the Chrome Extension’s storage so we can use it to send along with
future requests from this user to the rails API. If it isn’t successful then
we’ll just log the error.
Registering with new credentials we see the following logged in the dev console.
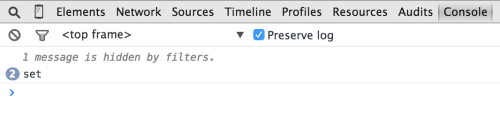
Sweet, registration was successful, our API returned a 200 status, and the chrome extension saved the userId. But notice the 2 next to set telling us that this message was logged twice (that’s strange). Now let’s make sure our errors are working correctly.
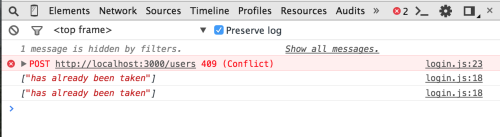
Trying to register the same email gives us the correct errors. But
wait! Once again the message was logged not once, but twice! Oh the hell fun
that is asynchronous JavaScript.
Time for some debugging. As mentioned earlier we could console.log() the
values of various variables at different points throughout or program, but
this would be very tedious and annoying, especially with the asynchronous
nature of this program. Why not make use of some of Chrome’s awesome
JavaScript debugging tools! While this post isn’t intended to go over all of
Chrome’s developer tools I would like to focus on the Sources tab, which
provides a graphical interface to the V8 debugger, allowing developers to
easily debug JavaScript code.
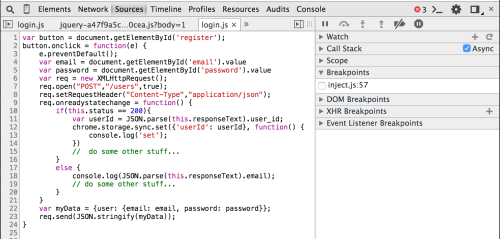
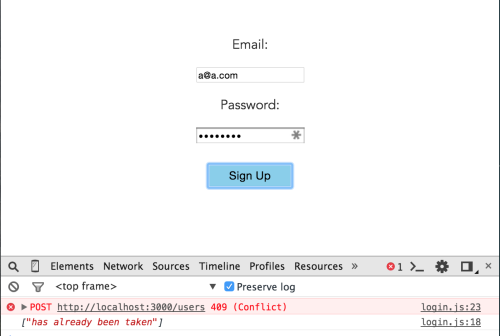
To the right of the error message chrome tells us what file, followed by what line of code caused the logged message. In this case the 409 response resulted from line 23 of login.js, and the logged response messages are both from line 18. Chrome makes these file/line numbers links - thanks Chrome Team. Clicking on login.js:18 takes us to the actual script downloaded from our server.
Expanding this tab you’ll notice another panel which enables us developers to actually run and interact with the code! We can change values, add variables, examine values, and do whatever it is we’d like, all while watching it run in the context of the current web page. Pretty rad!
There are many features to the Sources panel, but let’s focus on two very useful ones - Breakpoints and Watch Expressions.
-
Breakpoints allow us to stop/conitnue execution of the script at various points.
-
Watch Expressions allow us to watch variables and see how they change as a given script runs.
These two features combine to provide a very powerful tool.
Referencing the XMLHttpRequest API once again it looks like the status is
already available when the request object is in state 2, while the
responseText is partially downloaded by state 3.
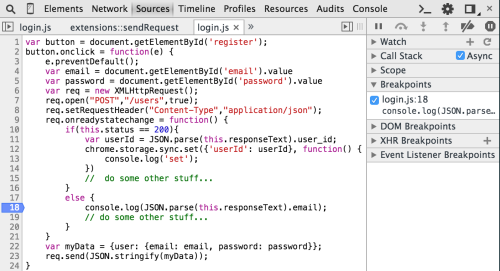
Let’s debug the error case, which is displaying error messages twice. We set a breakpoint at line 18 (by simply clicking 18 on the left panel) inside the else clause so that execution will stop each time this line of code is run.
Now we’re ready to set our Watch Expressions. I’m interested in the
values of the requests object’s readyState and status so I’ll add these to
the Watch Expressions.
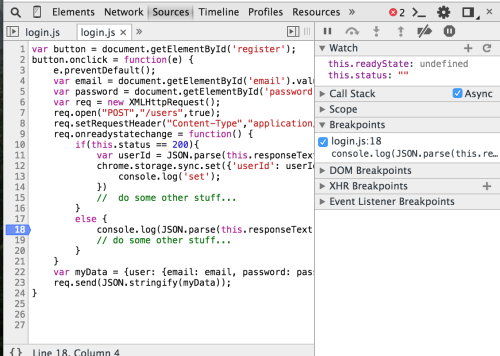
Before any code is executed the two values are both undefined, however we’ll soon see that these will change as we interact with the page. Filling in an email/password that is already taken and clicking Sign Up will kick off the JavaScript.
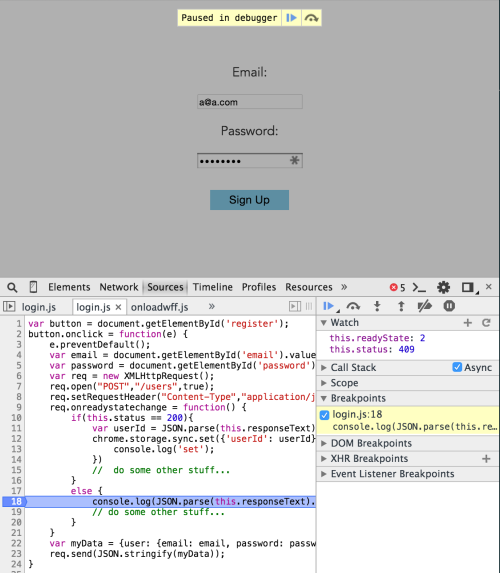
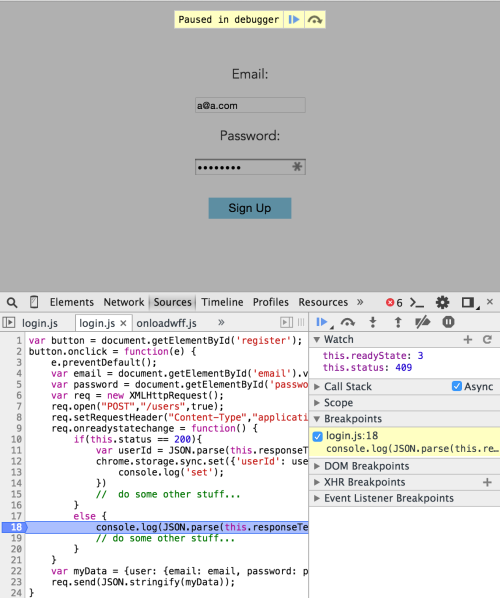
Our breakpoint was triggered and the debugger paused execution. it is
easy to see that readyState == 2 and status == 409. Clicking the continue
button will continue the execution of the script.
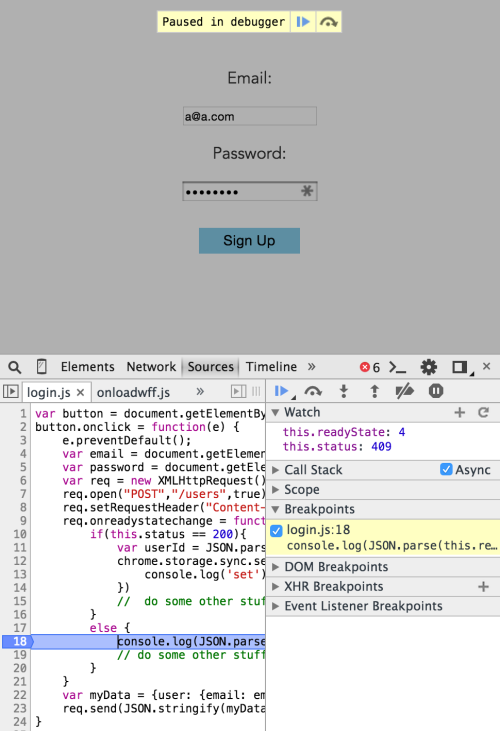
Sweet, looks like the request object’s status is still 409, however its
readyState is now 3! Let’s continue.
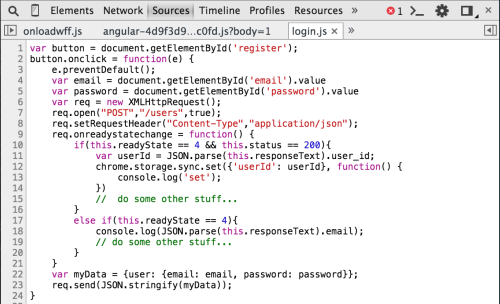
At this point the request’s readyState is 4 telling us the operation is
complete, and with this we have found the bug, which requires a very simple
fix. In the function body we must not only check for the status, but also
make sure the request object is in readyState 4 before executing any code!
Adding this to our script and removing the breakpoint:
We get the correct output of only one response message being logged!
Now we can move on to the fun parts of updating the UI to notify the
user they need to try a different email, however this is a whole different
blog post in itself and I’ve finished my beer. This post only scratches the
surface on the rich set of debugging tools Chrome provides web developers and
I hope to cover some more in the future. Using these tools will no doubt
save you hours of debugging in the long run, keep you from polluting your
codebase with the dreaded console.log(), and possibly allow you to come out
victorious against this thing they call JavaScript.