Callstack Profiling with Stackprof
We recently had Bryan Helmkamp, Code Climate founder and CEO, drop by the office and give a talk on what makes code good code - a subject he’s pretty knowledgeable on having spent the last few years building a very popular static code analysis tool that your team might even be using. One of his coolest slides was a graph of what exactly defines technical debt. Bryan’s definition of this term we hear all too often is summed up in his slide found below.
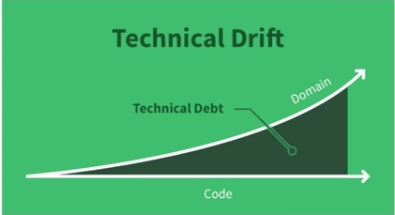
The x-axis is the lifetime of some piece of code. The y-axis is the current business domain. You can see when the code was written the business domain and the code aligned perfectly. Over time business goals shift, while existing code remains unchanged. The difference is technical debt. The only way to decrease technical debt is to better align code with the current business domain.
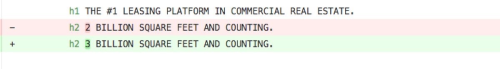
As our users have been busy adding data points, we’ve been busy adding code - lots of code. Going off of Brian’s interpretation of technical debt its pretty clear that, like any growing application, we’ve racked up some debt ourselves. In this post I’d like to walk through a recent adventure of mine descending down the deep rabbit hole of performance tuning. Along the way we’ll go over some of the tools I’ve picked up along the path to the automated synchronization of VTS clients’ 3 billion square feet, but who’s counting? 😉
One particular space my team, integrations, spends a majority of its time is building out our portfolio import infrastructure. This covers the onboarding of new client’s portfolios, updating existing clients’ portfolio acquisitions, as well as an ongoing technical effort to ensure VTS data reflects actions taken in any of the industry’s leading ERP systems, namely Yardi, MRI, JD Edwards, etc. It also means a constant tug-of-war between integrations, product, and sales around what data points our imports support. As Bryan reassured us, business domains change over time. As we’re heads down cranking on the integration infrastructure other engineering squads are tackling their respective features, consistently adding more data and metrics our users require access to. What started as a basic rent roll:
What is the RBA, or total rentable area of my asset?
How much of that is vacant?
has grown into one hell of a datastore:
Rights / encumbrances
-
Rent escalations (OpExs, Other Revenues, Real Estate Taxes, etc)
-
Future/historical leases
-
TIMS (Tenants In The Market)
-
Comparables
and this is only a fraction of what’s coming down the pipeline.
The code that efficiently imported one or two propertys’ basic rent rolls might not be suited to ingest the sheer volume of data our landlords, agency brokers, and tenant rep brokers work with on a daily basis.
At some point in the past few weeks we noticed our larger clients’ integrations taking a bit longer than usual. Nothing dramatic, but enough to warrant discussion. During our monthly 1:1 my CTO Karl mentioned he’s had lots of success pinpointing performance bottlenecks with a tool called stackprof and suggested I give it a look.
Profiling
The first step in any performance tuning epic is narrowing down exactly where the performance problem lives. Just looking at the logs proved one code segment in particular was taking significantly longer than usual. This path involves the parsing of flat files (.csv, .xls, .xlsx, .tsv, .psv) before importing the extracted data into a local datastore. The main entry point is `load_files_into_db()*.
def load_files_into_db(*files)
As you can guess takes some file objects and loads them into a database. Like any other application, this method kicks off a chain of method calls that end in a full database and a successfully terminated program. What would be cool is if we could locate exactly which function our application is spending the majority of its time executing. Enter stackprof.
Performance tuning is comparable to a trip to the doctor’s office for some persistent pain. Your doctor likely begins by taking vitals and asking basic questions in an attempt to form a hypothesis about what might be causing your pain. After arriving at some idea of what it could be she can employ more advanced techniques to truly find the issue. Dietary problem? Might be time for a blood test. Recently fell skating? An MRI should provide a better picture of what’s going on.
While I’m no doctor, my business card says software engineer and it turns out us software engineers have some pretty cool tools for diagnosing performance issues.
Taking an unusually long time to parse a file? Check.
You began noticing the issue when file sizes approached some memory threshold?
1MB? 4GB? 1TB? Gotcha.
Memory pressure remains relatively constant? Great to know.
Given my general software knowledge, my CTO’s recommendation, and a genuine interest in using your application as a guinea pig to learn more about performance optimization I’ll prescribe stackprof, a call-stack profiler to be taken at 1000ms intervals.
A great tool that stands out for having the biggest bang for its buck is a trusty sampling call-stack profiler. These profilers take a snapshot of an application’s call-stack at some given interval and record a variety of metrics that can be analyzed to draw a better picture of where an application may be spending too much of its time. Many, including stackprof, can be deployed to a production environment and silently collect data over time for later analysis, but I’ve found they can be just as useful on your local machine. For Ruby applications I prefer stackprof for a couple of reasons:
-
freely available on RubyGems
-
supports Ruby 2.1+
-
simple to use
The README does a great job explaining basic setup and usage so I won’t go into too much detail but we’ll cover the basics.
Add ‘stackprof’ to your Gemfile and bundle install.
The gem provides a class method run, taking some arguments and a block,
which we’ll use to wrap any code we’d like to profile. Wrapping
load_files_into_db we pass the following arguments:
-
mode: :wall - use wall clock time. This is just another way of saying profile this code using the overall amount of time it takes for this method (I/O included) to complete, not just the amount of time it’s hogging CPU.
-
out: ‘tmp/load_db.dump’ - write the results to a file tmp/load_db.dump
-
interval: 1000 - sample the call stack every 1000ms or 1 second.
With the profiler in place we can run our program as normal and analyze the results written to tmp/load_db.dump using the stackprof executable plus a couple of arguments instructing it to print the results in text mode and limit them to just the top 5 sampled methods.
stackprof tmp/load_db.dump --text --limit 5
Refactoring
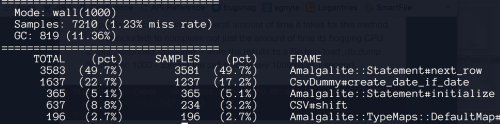
The first two columns show the total percentage and total number of samples
that the given method was on the call stack at all. The third and fourth
columns are a bit more interesting and are where we’ll focus our attention.
They show the number and percentage of samples that this method was on the
very top of the stack. An interesting point to note is that even though
CSV#shift was sampled more frequently than Amalgalite::Statement#initialize,
(637 v. 365) the latter appears higher in the list since it was on top of the
call-stack more frequently (365 v. 234). The higher number of total samples
with a lower percentage of time on top of the stack could mean that CSV#shift
might have been simply calling child helper methods and therefore was hanging
out on the stack until these functions returned. Or maybe we could have
picked a better sampling interval. For now let’s assume our interval was good
enough and take a look at the method stackprof most frequently found at the
top of the stack. These tend to be the most inefficient methods and some of
the lowest hanging fruit for serious performance improvements.
The method coming in at number one with stackprof finding it at the top
49.7%of the time is Statement#next_row. This is something we’d expect to see
seeing that it handles inserting a record into our database, an operation
that is hard to avoid given the whole job of this code path is to load
records into a database. Although we could probably optimize this let’s
assume it’s doing the best it can and look at the next method in the list
create_date_if_date. Now this is interesting. A method a little further
removed from the act of interacting directly with the database. What could
this method possibly be doing that’s taking so long? Looking at a similar,
yet overly simplified, example of our production code let’s see what we can
find out.
def create_date_if_date(field)
  Date.parse(field) rescue nil
end
The first thing that stands out is the rescue clause swallowing errors and
returning nil. As we know exceptions should be exceptional and for good
reason. Exceptions not only make our programs more difficult to reason
about, they’re also extremely slow to handle. create_date_if_date() takes one
argument field, which may or may not be a valid date string and passes it to
Date.parse. Date.parse in turn tries to parse it into a date object. Don’t
worry if you’re not familiar with the implementation of Date.parse, just know
it will try its best to parse a given string, but if passed something that
looks nothing like a date (i.e. Date.parse("Alex") or Date.parse("")) it
throws its hands up and raises an ArgumentError. Ruby’s rescue defaults to
handling StandardError (a superclass of ArgumentError), and eventually
catches the exception, returning nil. Great, if create_date_if_date() is
passed a date-like string it’s successfully parsed and when passed anything
else it simply returns nil.
This method works great if the majority of the time our method is receiving date-like strings to parse, but the reality is data comes in all shapes and sizes and while landlords do track lots of dates, they also track dollar amounts, square footages, street addresses, numbers, letters, and everything in between. This means that a good amount of the time we’re paying this method (in computational resources) to rescue tons of exceptions only to return nil - not a very efficient use of its time or ours. Just how much time is it wasting though? Before we can answer this and close out our discussion on performance tuning we need to jump down one more level and get a better understanding of just how poorly exception handling code performs. For this we’ll use Ruby’s Benchmark module. The Benchmark module allows us to to time two methods and print their results next to each other for easy comparison Let’s use two implementations of our function that we’d like to benchmark against each other.
with_rescue is an improved implementation that when passed an empty string
immediately returns nil avoiding the costly exception that would be raised
should an empty string be passed to Date.parse. with_rescue is our original
poorly performing function.
require "benchmark"
require "date"

def without_rescue(value)
  return if value.empty?
  Date.parse(value) rescue nil
end

def with_rescue(value)
  Date.parse(value) rescue nil
end

Benchmark.bm do |x|
  x.report("without rescue") do
    100.times { without_rescue("") }
  end

  x.report("with rescue") do
    100.times { with_rescue("") }
  end
end
Calling each function 100 times with an empty string produces the following results.
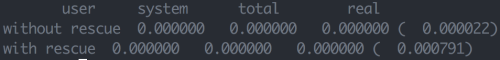
This tell us without_rescue took a total of .000022 seconds (.022ms) to run
100 times, while with_rescue ran in .000791 seconds (0.791ms) . Clearly,
avoiding the exception using without_rescue is faster, but only by 0.766ms
faster, so who cares? Does it really matter that we can save ~half a ms with
our new implementation? Well, actually we do. Just as every data point in
practice doesn’t happen to be a date, our client portfolios in practice don’t
happen to pass only 100 values through this little function. Think of your
basic spreadsheet. You might easily have 20,000 rows and 100 columns
totaling 2,000,000 cells - all of which will be passed through this little
function. Let’s rerun this import using a more realistic number, say
2,000,000, still well below production loads, but enough to give us a result
that makes more sense to us humans who have an easier time thinking in terms
of seconds not thousandths of a second.
This time we run the same code but call each function 2,000,000 times and check out the results.
Benchmark.bm do |x|
  x.report("without rescue") do
    2_000_000.times { without_rescue("") }
  end

  x.report("with rescue") do
    2_000_000.times { with_rescue("") }
  end
end
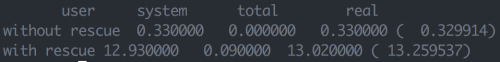
Our improved function without_rescue took a mere .33 seconds (330ms) versus a
whopping 13.26seconds (13260ms) for with_rescue to finish! Now this was only
2 million data points run through a simplified version of our code, but you
can imagine the performance hit we’d take with 5 million or 20 million or 1
billion values passing through this guy.
We certainly haven’t finished refactoring this function, but I’d say we’re off to a good start. Rerunning stackprof we no longer see our function in the top 5 most profiled methods and for this I’m stoked.
Now the real point of this post isn’t to teach you the proper way to handle Ruby exceptions, the ancestry chain of the Ruby Exception api, or even how to use a call stack-profiler like stackprof, even though those are all cool topics. I think the whole reason I wanted to share this short story was to paint a better picture of how business needs change over time and because of this we need to make sure that as software developers our code keeps up with ever shifting product requirements. This wasn’t poorly performing code at the time it was committed and deployed. It did its job and it did it very well. For our requirement at the time 1ms v. 50ms didn’t make much of a difference when we were importing 1 unit and the whole program completed in under 1 second. Over time our needs changed, portfolios grew, and we made time to narrow the gap between our x and y axes. Hope you enjoyed.
Find this cool?
Tweet me @askwheeler
https://github.com/alexwheeler